Example
As pair copula constructions become quite complicated in higher dimensions, we want to introduce most of the theory with the aid of a concrete example. In this example, we look at the joint distribution of 7 variables. The following network visualization shall give a first impression of how individual variables get connected in our pair copula construction. Nevertheless, this graph is in no way unique, so that any visual characteristics like proximity could be due to graphical artifacts only. Also, we only show conditional links up to layer 3:

R-Vines
Transforming an R-Vine matrix to tree notation:
Standard notation
We will use the example of Dißmann (page 31):
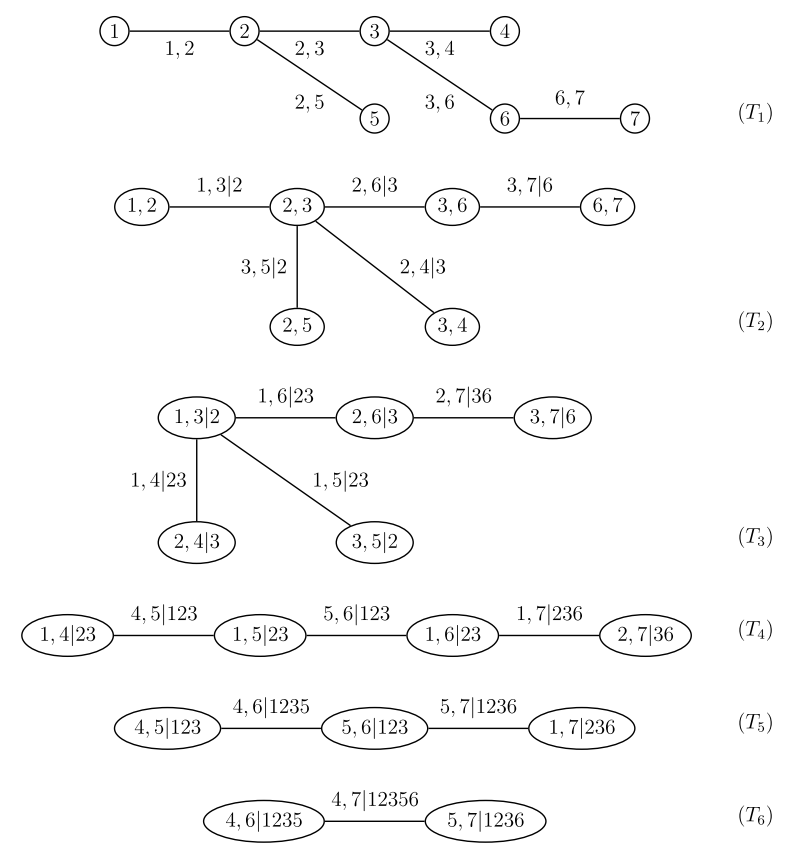
As Dißmann13 shows, this vine decomposition can be expressed as R-Vine matrix. Two possible R-Vine matrices are (page 36):