Germany's Electric Grid: Keeping the Lights On Amidst the Green Shift
Germany is navigating its ambitious energy transition, the Energiewende, aiming for a future powered by renewables. But transforming the energy system of Europe’s largest economy is a complex undertaking. How is this green shift actually unfolding on the ground? Let’s dive into recent German electricity data to explore the real-world patterns, progress, and persistent challenges.
The Rhythms of Power Demand
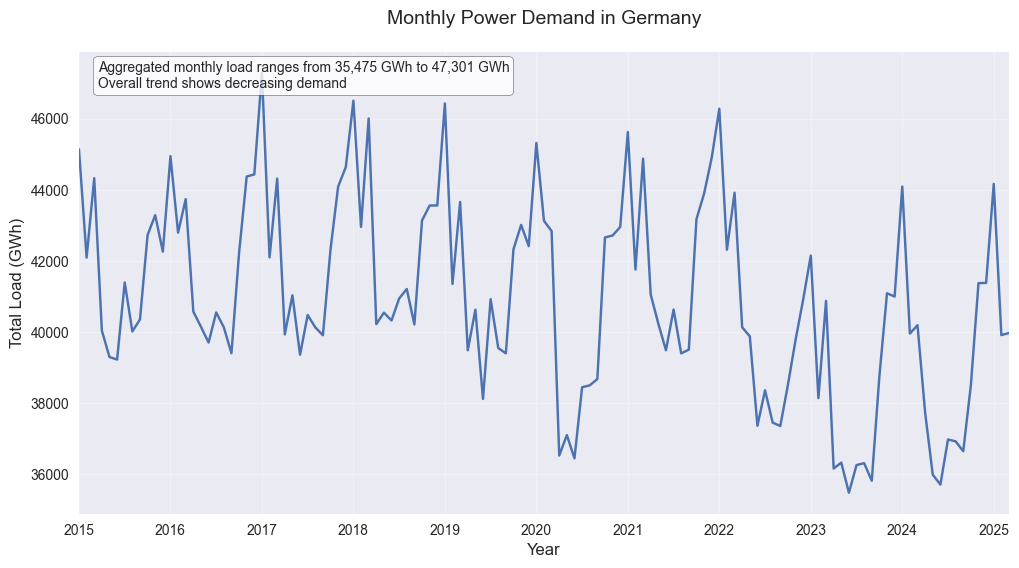
Understanding when and how Germany uses electricity is the first step. Like the tide, the nation’s power consumption follows distinct rhythms. Looking at the total monthly electricity use over recent years reveals significant fluctuations. Interestingly, despite these ups and downs, the overall long-term trend suggests a slight decrease in total demand.
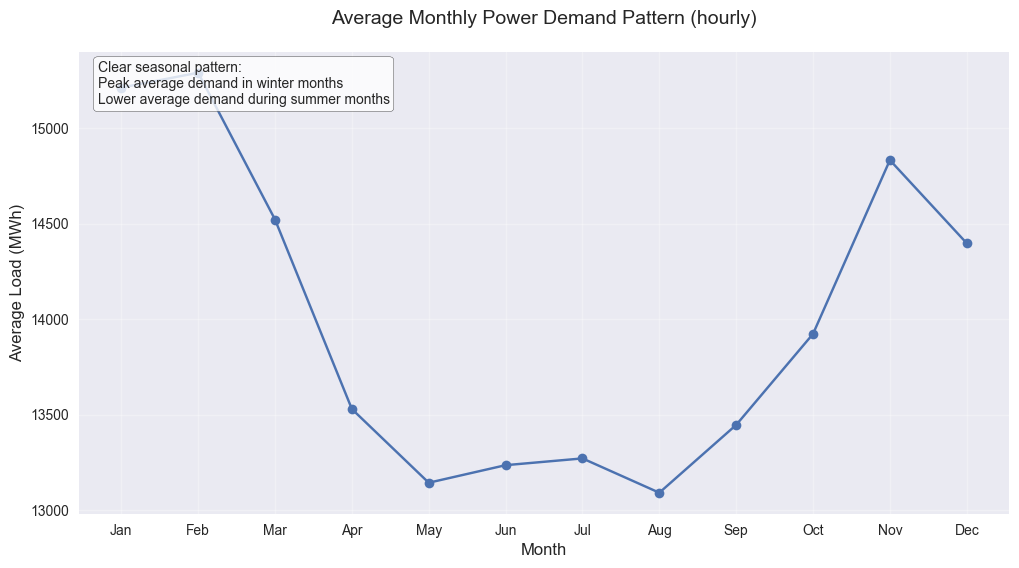
Zooming into the annual cycle, a clear seasonal pattern emerges. Demand surges during the cold, dark winter months, peaking in January, driven by heating, lighting, and more time spent indoors. Conversely, consumption hits its lowest point during the warmer, brighter summer months.
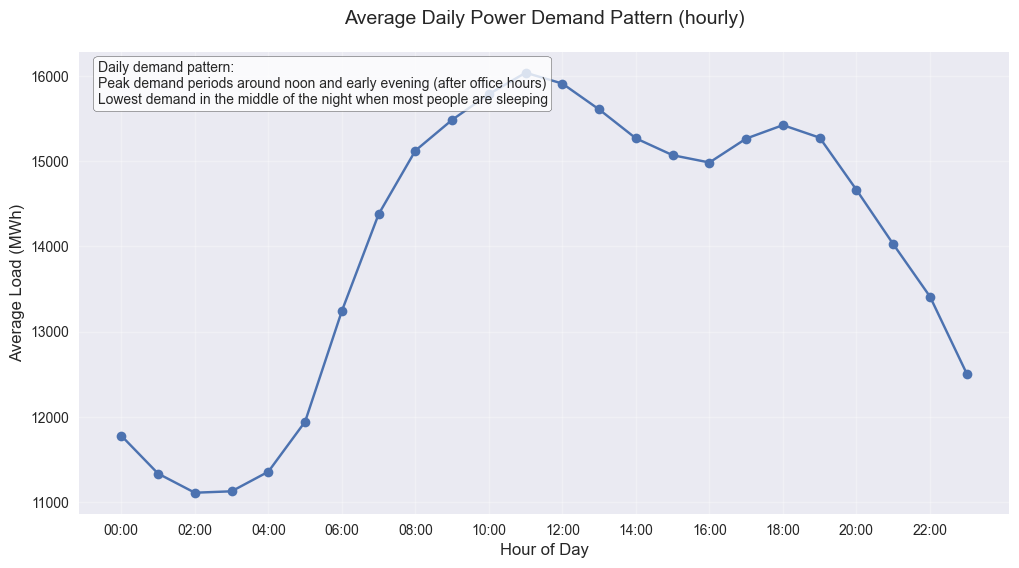
Even within a single 24-hour period, electricity use follows a predictable daily pulse. It ebbs to its lowest in the dead of night, rises sharply as the country wakes and commutes, often peaks around noon, dips slightly, and then frequently sees another surge in the early evening as people return home.
A Grid in Transition: The Evolving Energy Mix
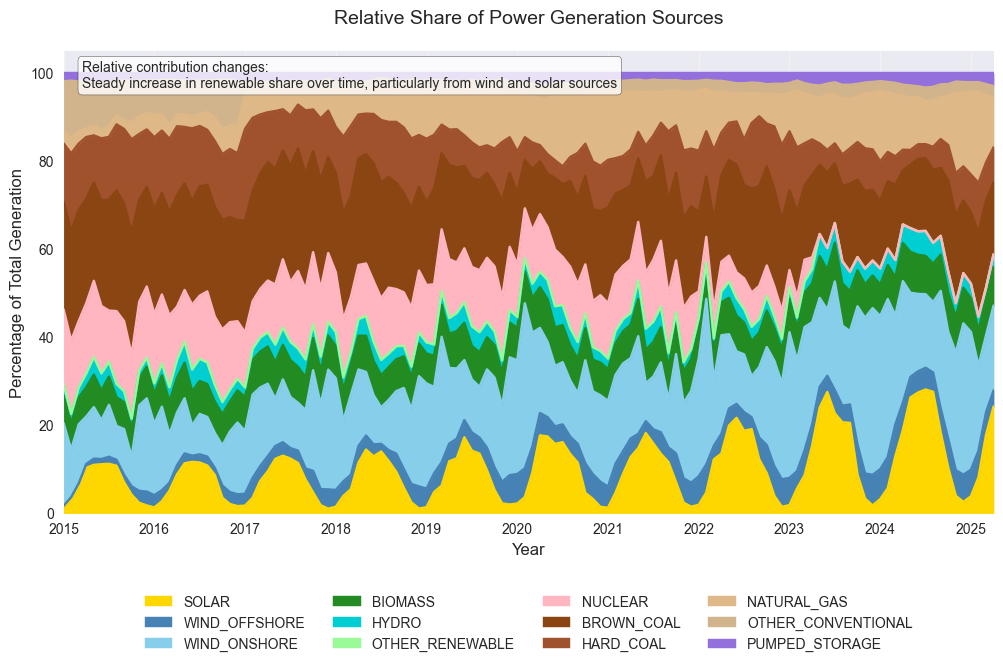
So, where does Germany get the power to meet this fluctuating demand? The answer lies in an energy mix that is visibly changing, reflecting the Energiewende’s influence. Over the years, renewable sources like solar, wind (both onshore and offshore), biomass, and hydropower have steadily increased their contribution – you can see their colourful bands widening on the generation charts. Simultaneously, nuclear power generation has been phased out.
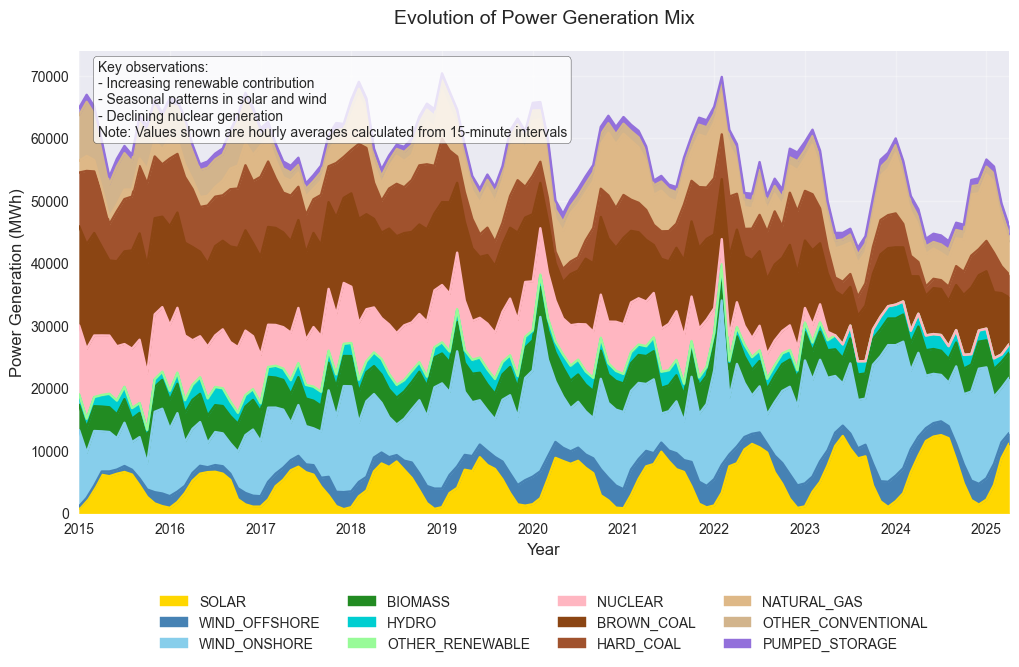
However, this transition is far from complete. Conventional sources, especially coal (both brown and hard) and natural gas, remain indispensable pillars of the system. They fill the gap, particularly when the sun isn’t shining brightly or the wind isn’t blowing strongly. Looking at the percentage share each source provides makes this dynamic even clearer. While renewables are claiming an ever-larger slice of the pie, highlighting the transition’s progress, the grid’s reliance on conventional fuels, especially during certain periods, remains significant.
Sunshine and Squalls: The Nature of Renewables
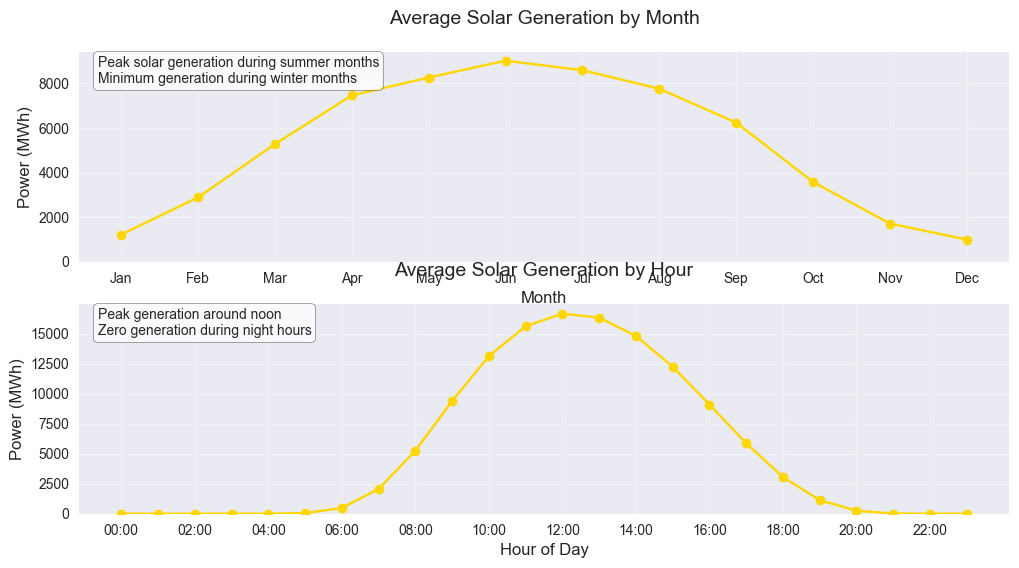
Wind and solar power are the powerhouses of Germany’s renewable expansion, but their output is dictated by nature’s rhythms. Solar generation predictably mirrors the sun’s path: soaring during the long, sunny days of summer and dropping off in winter, while daily output peaks around noon and disappears at night.
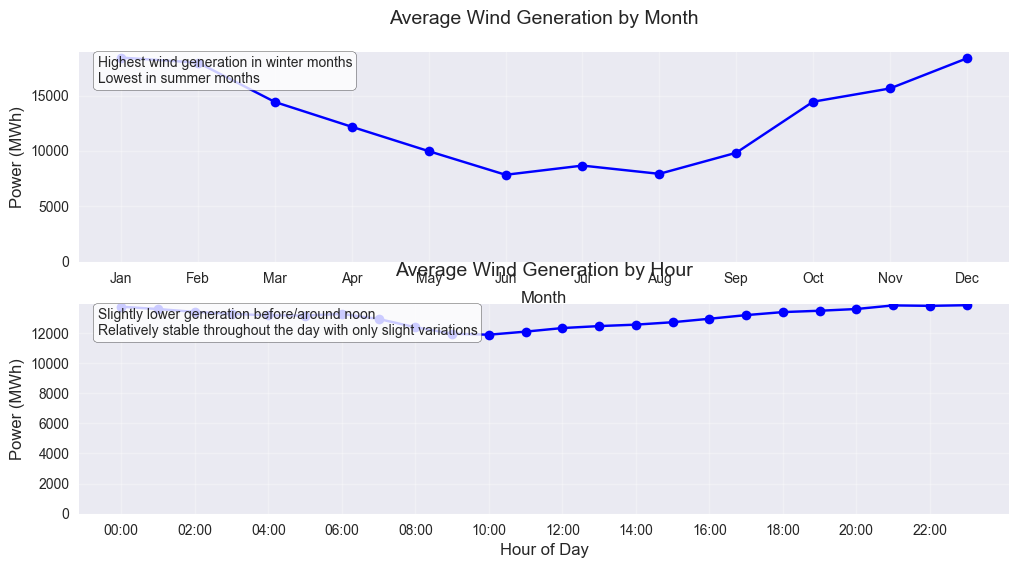
Wind power often acts as a valuable counterpoint. It tends to generate more electricity during the windier winter months and less during calmer summer periods, complementing solar’s pattern. While wind output certainly fluctuates based on weather, its average hourly generation is generally more stable throughout the day compared to solar, though it might see a slight dip before noon.
The Stability Challenge: Balancing the Grid
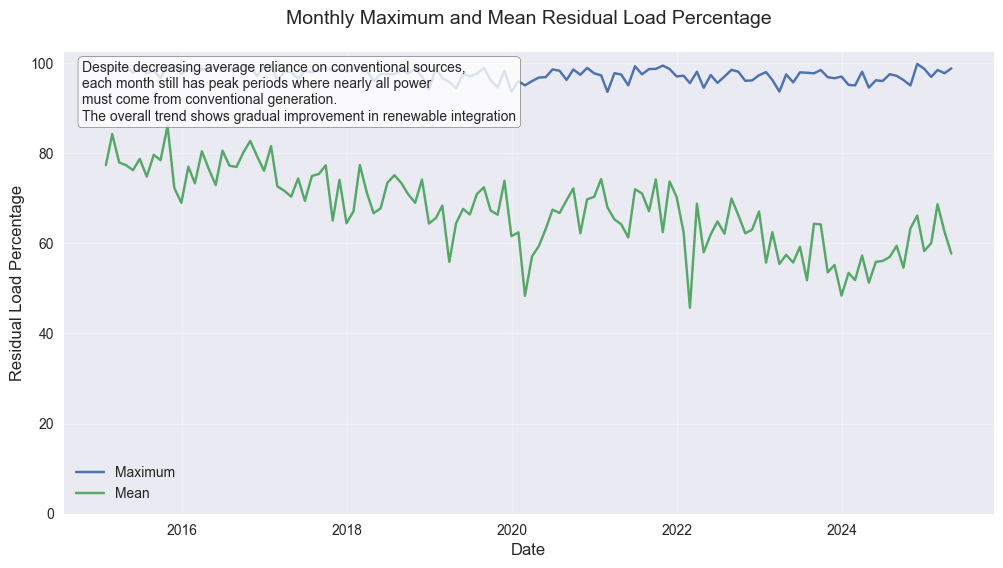
The inherent variability of wind and solar presents the central challenge of the Energiewende: ensuring a stable and reliable power supply at all times. When renewable output is low, the remaining demand – known as the “residual load” – must be covered by other means, primarily conventional power plants or energy storage.
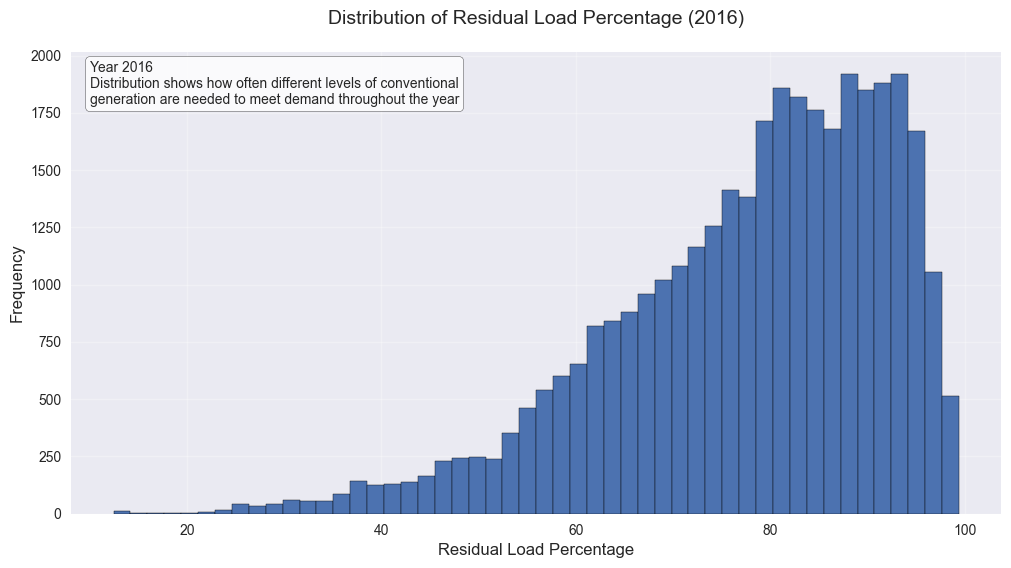
Analyzing this residual load reveals crucial insights. While Germany has successfully reduced the average reliance on conventional power over time, thanks to growing renewable capacity, a critical challenge persists. Data shows that in every single month, there are still peak times when renewable generation is minimal, and nearly all electricity demand must be met by conventional sources. The average need for conventional backup is decreasing, but the maximum need remains high, underscoring the ongoing requirement for flexible, dispatchable power.
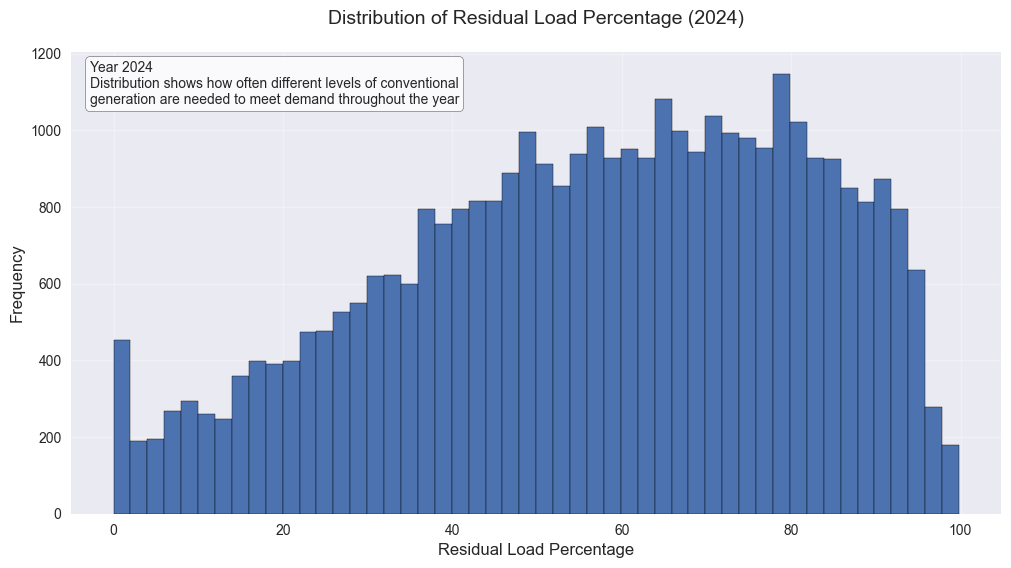
We can visualize the progress by comparing how often the grid relied heavily on conventional power in different years. Histograms comparing, for instance, 2016 and 2024 show a clear shift. In the more recent year (2024), periods requiring extremely high levels of conventional generation occurred less frequently than in 2016. The distribution has shifted towards lower residual load values, indicating successful integration efforts.
To further quantify this shift, we can use an Empirical Cumulative Distribution Function (ECDF) plot. Think of an ECDF as showing, for any given level of residual load (on the horizontal axis), what proportion (or percentage) of the time the actual residual load was at or below that level (on the vertical axis).
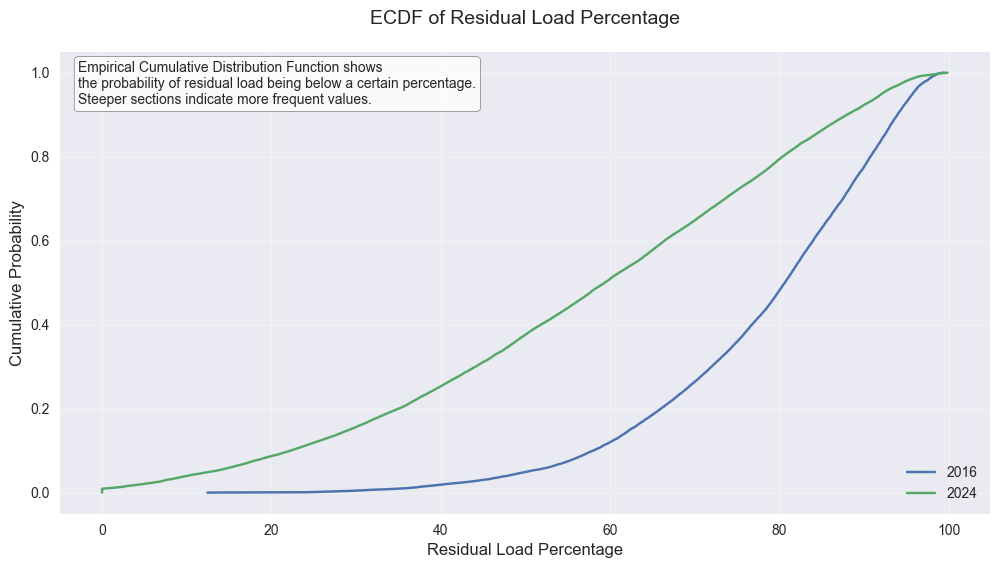
In the ECDF comparing 2016 and 2024, we see two curves. The curve for 2024 is clearly shifted to the left compared to the 2016 curve. How to interpret this? A shift to the left means that for any given proportion of time (say, 50% or 0.5 on the vertical axis), the corresponding residual load percentage was lower in 2024 than in 2016. For example, finding the point where the 2024 curve crosses the 0.5 probability line shows the residual load value that was exceeded only 50% of the time in that year. Comparing this point to the equivalent point on the 2016 curve demonstrates that this median residual load was significantly lower in 2024. In essence, the ECDF visually confirms that lower levels of residual load (meaning higher renewable contribution) became much more common in 2024 compared to 2016.
The Path Forward
Germany’s energy transition is a dynamic process, reflected clearly in its electricity data. Demand follows established patterns, while the generation mix steadily incorporates more renewables. The growing contribution of wind and solar is undeniable progress. However, the data also starkly illustrates the challenge of managing variability. The persistent need for conventional power during periods of high residual load underscores that grid expansion, flexible backup systems, and significant advancements in energy storage are not just desirable but essential components for navigating the final stages of the Energiewende and ensuring a stable, reliable, and green power future.
Disclaimer: Credit where credit’s due: I wrestled the data into submission and drew the conclusions. My AI assistant then helped dress those findings up in proper sentences, saving you from my purely technical jargon. You’re welcome.